Models
An essential part of analysis work is modeling certain parts of the business and IT landscape in order to either understand them, document their as-is state, or outline their future state. The scope of what can be modeled is quite broad, ranging from organizational structures to database schemas. Fortunately, analysts have a wide range of modeling techniques available and can select the most appropriate one for each task. This is good news, but also a hidden trap.
Since the number of techniques is large, the average analyst does not use all of them regularly and therefore cannot be an expert in all of them. This is one of the reasons why so many analytical teams produce poor models. Learning all modeling techniques in depth takes a lot of time, which only a handful of analysts are willing to invest. For this reason, instead of trying to be another "UML/BPM/ERD/DFD..." reference, we will focus on what we consider the essential techniques that, in our opinion, are beneficial regardless of the project an analyst works on. Our goal is to describe only the basics without going into details that ultimately only a few people understand. We would also like to go beyond standard "modeling tutorials" and show how to apply these techniques in real life, along with the dos and don'ts. The goal of this chapter is not just to teach how to draw a diagram in a specific modeling notation but also to demonstrate how to use a specific diagram on a real project in a way that provides value. The difference between these two is similar to the difference between driving a car in a small village and driving a truck in downtown New York City.
Temporary Models Vs. Models to Keep
A model, like any other form of documentation, takes time to create and maintain, so the existence of every model must be justifiable. The first aspect to consider before creating a model is whether the model should be created in the first place. Models must not be created just because some guideline says so. There must always be a need for the model, and the model must provide value.
If the author has justified the creation of the model, the second aspect to consider is whether the model is valuable enough to be kept as part of the documentation or whether it will be discarded. This is a crucial decision that is going to influence what the model will look like. If the purpose of the model is to explain a low-level system design to developers, it serves a single purpose and will not be needed after the issue is clarified. In such cases, it does not make sense to create a perfect UML diagram in a sophisticated CASE tool when a quick whiteboard or pen-and-paper sketch would be sufficient.
On the contrary, if the model is a high-level overview that is likely to be used by dozens of people whenever someone wants to revisit the topic, it would be worth considering creating a more formal, higher-quality model.
Modeling Approaches
Depending on their purpose, models can take various forms and levels of formality.
Standard Notation or Free-Form Diagrams
A diagram notation means that the "boxes and lines" that make up the diagram have semantics—it is agreed what each diagram element represents and what its meaning is. The good news is that analysts do not need to invent new notations themselves. Most aspects of business and IT can be modeled using existing notations, whether UML for modeling systems, ERD for describing database entities, or BPMN for modeling processes. Using these standard notations has the benefit that, regardless of the domain, organization, or project, the model is readable to anyone familiar with the notation being used. People can then communicate using a common language, which makes models shareable between teams and even across organizations. Nevertheless, this approach also has several disadvantages that may not be obvious at first glance:
- People have to learn the notation, and the level of knowledge varies among teams
- To address all modeling needs, modeling standards have become very complex. As a result, only a few people know the entirety of UML from A to Z, for example, so most people use only a limited subset of it anyway.
- Business stakeholders may struggle to understand the more advanced parts of the notation
- We do not identify with the common belief that business stakeholders do not understand diagrams. Experience has shown that if the notation is explained well and only the basic elements are used, stakeholders pick it up very quickly. Nevertheless, more specialized elements should be avoided.
- Standardized diagrams do not cover all modeling needs
- Modeling standard aspects of business and IT, such as processes or data, can be done easily using existing unified notations such as UML or BPMN. However, despite the complexity of these standards, they were not designed to model everything. In cases where standard notations are not sufficient, a so-called free-form diagram can be used. Such diagrams have no formal rules, so their modeling potential is virtually unlimited. On the other hand, they are not readable without an explanation of their semantics.
Diagrams vs. Models
So far, we have been using the terms diagram and model interchangeably. We interpret a model as an abstraction of something—a simplified description that helps us understand complex systems. As such, it has essentially the same meaning as a diagram, which is a simple drawing that outlines the form or workings of something.
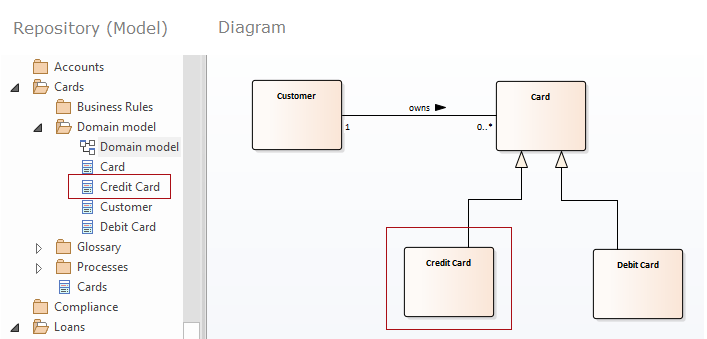
Even though we are going to continue using them as synonyms in most situations, we also need to understand the other meaning. From the perspective of enterprise modeling, a model means more than just a drawing. A model is a data structure that holds information about the various elements that make up the enterprise and the relationships between them. Having a model means having data about these elements, which can answer questions such as: "Who uses this service?" or "What are the attributes of this table?" The purpose of creating a model is not just to capture information visually but also to continuously build a database of objects, their attributes, and the relationships between them. Having such a repository allows us to quickly discover relationships between various aspects of the enterprise or query the database to identify dependencies. In addition, the database is built automatically—drawing diagrams automatically creates the corresponding elements and relationships in the repository.
On the other hand, creating a diagram means simply drawing a picture. Even though the semantics of the diagram elements are known, the result is just a collection of shapes and lines. Since there is no underlying repository behind those shapes, it is not possible to work with the elements as if they were objects. A diagram is nothing more than one of the possible graphical representations of a model.
So does that mean diagrams should not be used? Definitely not. Drawing a quick sketch or a hand-drawn diagram is very easy and effective, so if the goal is simply to communicate something visually and the output is not intended to be preserved, a simple diagram is a good choice. However, there is no single criterion that determines whether to create a simple diagram or start building a robust model. As with most analysis approaches, the decision must be evaluated on a case-by-case basis to determine what will work best in a given situation. You may work on a rigid waterfall project and need to quickly sketch a freehand version of a to-be process just to show it to stakeholders and gather their initial feedback. On the other hand, you may be part of a fast-paced agile environment, yet due to the complexity of the project, you may still need to create a robust model to manage dependencies between systems, processes, people, and so on.
When a diagram is usually sufficient
- The purpose of the model is to clarify something rather than document it
- The modeled aspect is still changing significantly, and reworking a complex model would be expensive
- The modeled aspect includes abstract elements that will never be part of the repository (see the example in the Free-Form Diagram section)
When to consider creating a model
- The modeled aspects are stable and general enough that they will not change often, and documenting them for future reference will be beneficial. The elements will be reused, and it may be necessary to query them along with their relationships.
- The team draws many diagrams that all share the same elements, making them difficult to maintain (renaming an element means updating dozens of diagrams)
Multiple Models
To understand a problem thoroughly, it is often necessary to look at it from different perspectives by creating multiple diagrams. This usually involves combining static and behavioral views. The static view describes structure and relationships, whereas the behavioral view focuses on functions and interactions. The static view represents the what—the components and how they relate to one another. However, the core value lies in the behavior—how the components interact and behave.
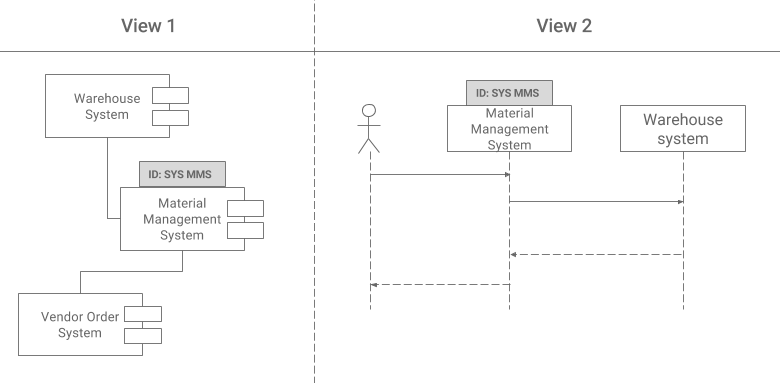
The need to create different views of the same aspect is why the concept of storing elements in a repository and reusing them across multiple models was introduced. Individual views share the same components, which saves time when creating diagrams and also streamlines maintenance, as each change is immediately propagated to all diagrams.
Good Practices
1. Select Diagram Style
A diagram can be drawn using a standardized notation with all elements perfectly aligned, but it can also be drawn as a collection of ad hoc boxes and lines sketched on a paper napkin. There are situations where a formal diagram provides the greatest value, but very often, a simple whiteboard sketch will do the job with minimal effort. The author must always understand the purpose and audience of the diagram and evaluate the appropriate style accordingly.
Modeling standards are nice, but what matters more is using notation that your audience actually understands.
— Scott W. Ambler
2. Do Not Tune Models to Perfection
All models are wrong, but some are useful.
source: Wikipedia
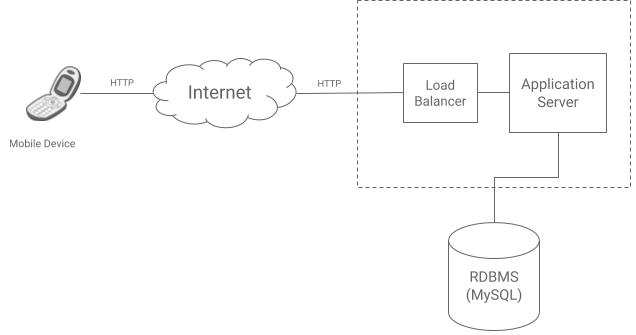
The goal of modeling is to simplify reality, so models never include the entire picture of the aspect being modeled. Do not try to model every detail of the problem; focus only on communicating the essential points. If the goal is to outline the core communication paths between systems, it does not matter if the model does not cover every interface. Certainly, it does not reflect the full reality, but that was never the purpose. The model must align with its purpose, so just make sure the audience understands it and does not mistake it for a comprehensive inventory of all interfaces.
3. Follow Modeling Conventions
The core skill in modeling is creating the right model, meaning that the most appropriate diagram is used to communicate the problem clearly. An equally important skill is creating the model correctly, which means following common modeling conventions. In an ideal world, the reader would not be able to tell whether the models were created by a single author or by a team. This is obviously unrealistic, yet all diagrams should at least look similar and be drawn using the same modeling style. In addition, the chosen modeling rules and style can greatly influence readability.
- 7 +/- 2 Symbols
- Complex diagrams are difficult to read because readability decreases rapidly when a diagram contains more than 9 elements. For this reason, a diagram should contain between 5 and 9 elements to remain easy to understand while still providing value.
- Break Up Complex Diagrams
- Complex diagrams that contain more than 9 elements should be decomposed into multiple smaller diagrams.
- Diagram Layout
- Minimize Crossing Lines - although crossings cannot be eliminated entirely, the fewer crossings there are, the cleaner and easier the diagram is to read.
- Orthogonality - diagrams appear clearer and more organized when elements are positioned evenly and all lines are either horizontal or vertical. Bends should use right angles.
- One-Way Diagrams
- Diagrams that depict a flow, such as activity diagrams, should be organized in a one-way manner, meaning the flow starts on the left and moves to the right or from top to bottom. It should not jump back and forth.
- Consistently Sized Elements, Sensible Colors
- All diagram elements should be consistent in terms of size and color. Of course, some key elements may be highlighted by making them larger to emphasize their importance, but this should not become common practice. The same applies to colors. Use them wisely, and do not make diagrams look like traffic lights.
- Naming Conventions
- Throughout Effective Analysis, we recommend naming artifacts consistently. The same rule applies to diagram elements. Use cases, activities, and classes each have their own naming conventions, which should also be respected in diagrams.
And remember...
Model is like humor. When you have to explain it, it's bad.
(inspired by Cory House)