Data Models
Ordinary day-to-day analysis work is almost always related to information systems whose primary purpose is to manipulate information – data. This means that a large part of what analysts do involves describing and analyzing data, making it highly important for them to know various data modeling techniques. Whether the core of the work is business analysis or systems analysis, data is everywhere, though always at a different level of abstraction. It could represent domain objects that describe real-world entities, or it could be data attributes within an information system. Both need to be documented, but they require different modeling approaches.
According to the level of abstraction, data models are divided into 3 categories as defined by ANSI:
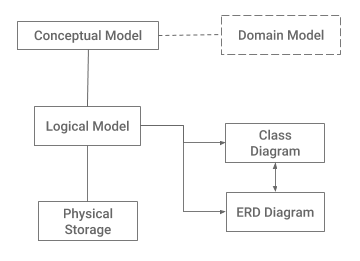
- Conceptual data model
- Describes the semantics of a domain. For example, it may be a model of an area of interest for an organization or industry. This consists of entity classes, which represent kinds of things of significance in the domain, and relationship assertions about associations between pairs of entity classes.
- Logical data model
- Describes semantics as represented by a particular data manipulation technology. This consists of descriptions of tables and columns, object-oriented classes, and XML tags, among other things.
- Physical data model
- Describes the physical means by which data are stored. This is concerned with partitions, CPUs, tablespaces, and the like.
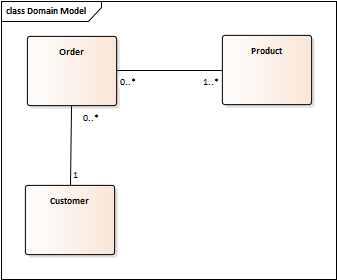
Conceptual Data Model
A conceptual model, often referred to as a domain model, is usually composed of classes, which represent domain entities, and the relationships between them. The domain model is elaborated in more detail in this chapter.
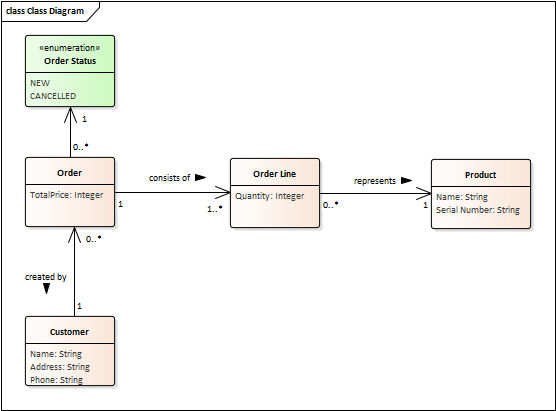
Logical Data Model
Unlike a conceptual data model, which is completely independent of any data manipulation technology, a logical data model reflects whether object-oriented, relational, or another technology is being used. Depending on the chosen approach, a class diagram (in the case of implementation in object-oriented technology) or an entity-relationship model (ER diagram) is used to capture aspects specific to the underlying technology.
Class Diagram
Entity-Relationship Diagram
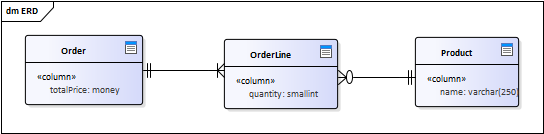
Note: An ER model is sometimes mistakenly called a physical data model. A physical model does not mean tables in a concrete database; it describes the physical storage, real machines, CPUs, and their locations.
Good Practices
Data modeling is a broad discipline, and simply listing all good practices and antipatterns would provide enough material for a whole book. For this reason, consider the following list only as a short summary of what we see analysts doing wrong over and over again, or not doing at all:
- Each entity must have a self-explanatory name – a singular noun such as Car, Order, Account, Contact
- Tables should be named in the plural: Cars, Orders
- Each entity must have a short, unambiguous description explaining its meaning from a business perspective. To make the description clear, it can also include examples of what should be considered an instance of the given entity and what should not.
- Do not include business rules, state transitions, etc., directly in entity descriptions. Reference them instead to avoid duplication.
- For example: "When an Order is not paid within 48 hours after it was created, it is canceled."
- The same rules apply to entity attributes.
- For example:
Contact:Mobile– Represents a contact's mobile phone number. Only one mobile phone number is supported per Contact, so it can be a home, work, or any other type.
- For example:
- The same rules apply to relationships between entities.
- For example:
Company-->Person [m:n]– Represents people working for a company. An organization can employ many people (including 0), and a single person can work simultaneously for multiple organizations (or even 0).
- For example:
- Include examples
- Entity Car – "VW Passat 2.0 TDI"
- Relationship Company-->Person – "John Smith working for IBM"
- Follow the rule of 7 ± 2 elements per diagram and split the diagram into several smaller ones if the number of entities exceeds nine.