Activity Diagram
An activity diagram is a graphical representation of behavior depicted as a sequence of steps. It can be used to model any business or technical activity, including business and technical processes as well as computer algorithms. Basically, it serves the same purpose as a traditional flowchart but comes with much richer semantics.
Elements
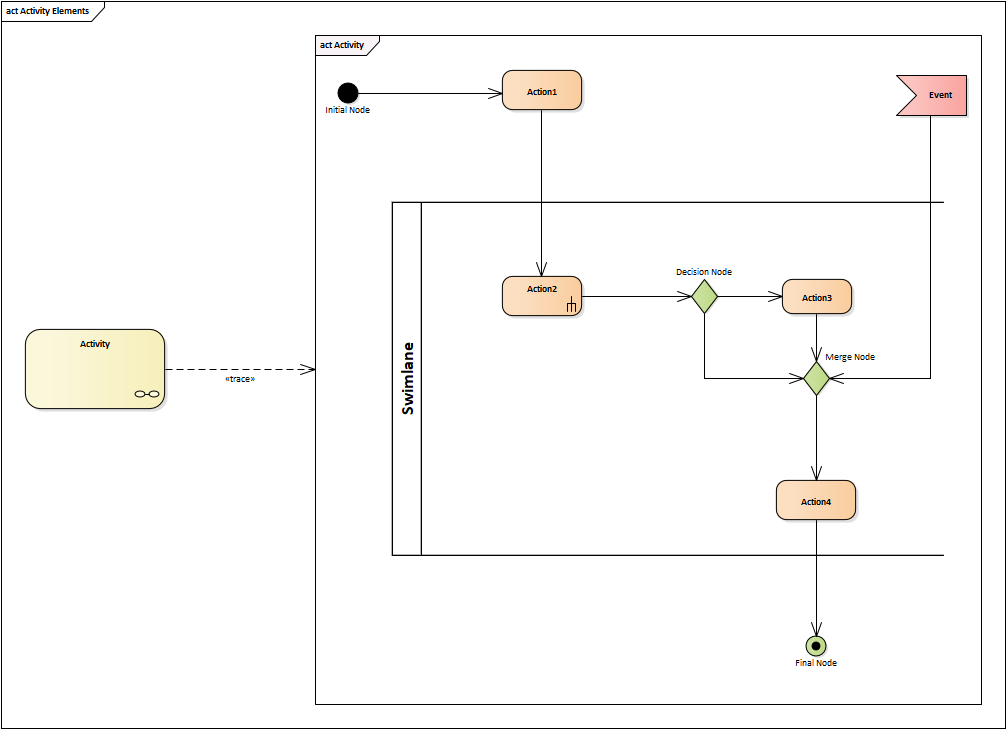
- Activity
- An activity represents a behavior
- Action
- An action represents a single step within an activity
- Actions can be further specified by a behavior. For instance,
Action2indicates that its behavior is described within a separate activity.
- Swimlane
- Swimlanes group activities performed by the same actor or system. This is useful for modeling processes and workflows to indicate who actually performs a particular step.
- Control flow
- A connector that shows the flow of control between steps
- Decision node/Merge node
- A decision node accepts tokens on an incoming edge and presents them to multiple outgoing edges
- Which of the edges is actually traversed depends on the evaluation of the guards on the outgoing edges
- A merge node merges all incoming tokens into a single outgoing token. In the example above, the flow proceeds to the Final Node as soon as any of the control flows reach the Merge Node. Without the Merge Node, the flow would wait until both flows reached the Final Node.
- Fork/Join
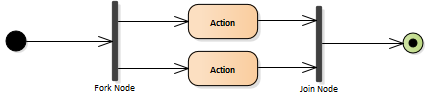
- A fork node is a control node that splits a flow into multiple concurrent flows. Both actions in the picture will be executed.
- A join node is a control node that synchronizes multiple flows. In other words, the flow waits until all concurrent flows reach the join node.
- Event
- An event represents an external trigger, such as an incoming message or a time event indicating that the control flow starts at a specific time
- For time events, a clock symbol is usually used

Modeling
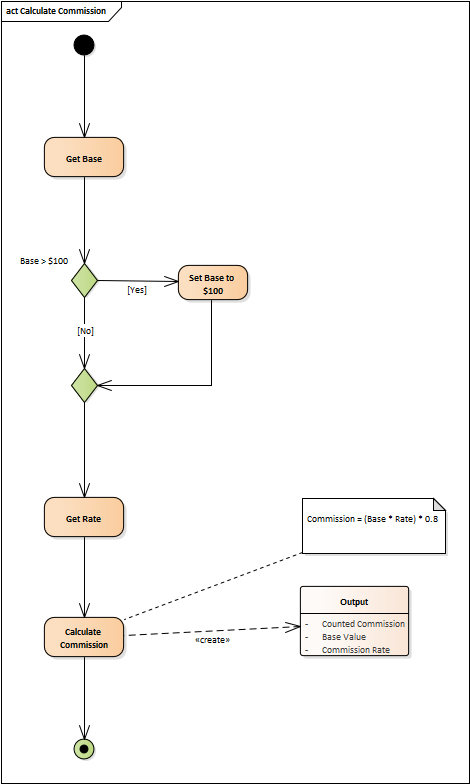
The core function of an activity diagram is to visualize behavior, yet it can also include other useful information, such as what output a particular step produces, what function it calls, or how it changes an entity's state.
1. Output
If an activity represents a calculation that generates data as an output, it is useful to describe the format of the result. The following example shows the format of a calculated commission by connecting the activity to the generated data object using a create connector.
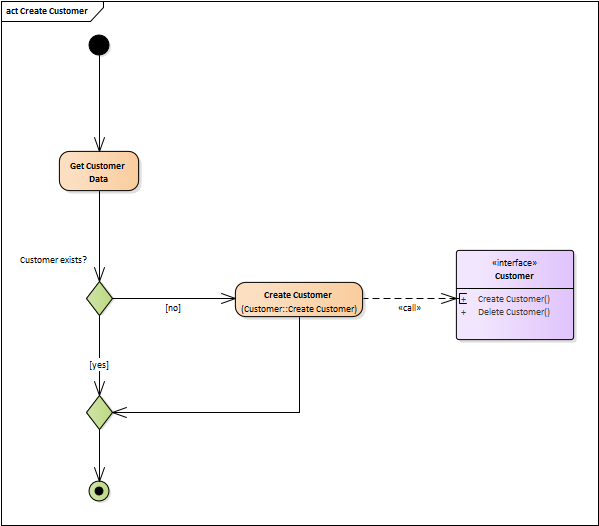
2. Function or Service Call
Since actions are the lowest-level atomic elements, they are often used to model the invocation of a concrete function or service (referred to as an operation call in UML terminology). The model below shows two possible ways to model a service call: using a dependency relationship and without it.
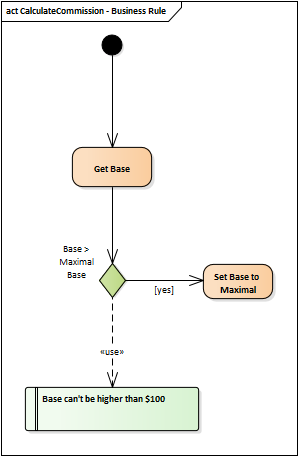
3. Condition
The flow of activities and actions is controlled by guards, which specify the conditions for selecting a particular branch. Very often, the condition represents a general business rule stored in a business rules repository, so it is sufficient to reference it instead of duplicating it.
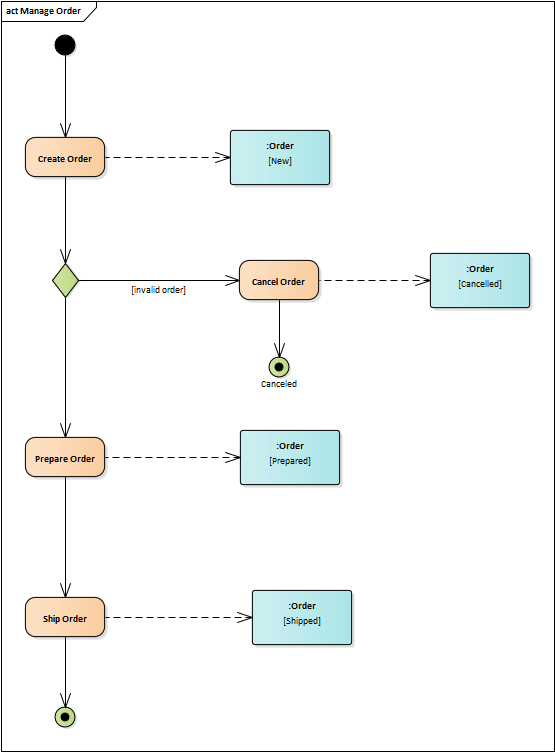
4. States
Sometimes it is useful to indicate that an activity changes the state of an entity. The following flow depicts an order processing workflow and shows how the process changes the order state.
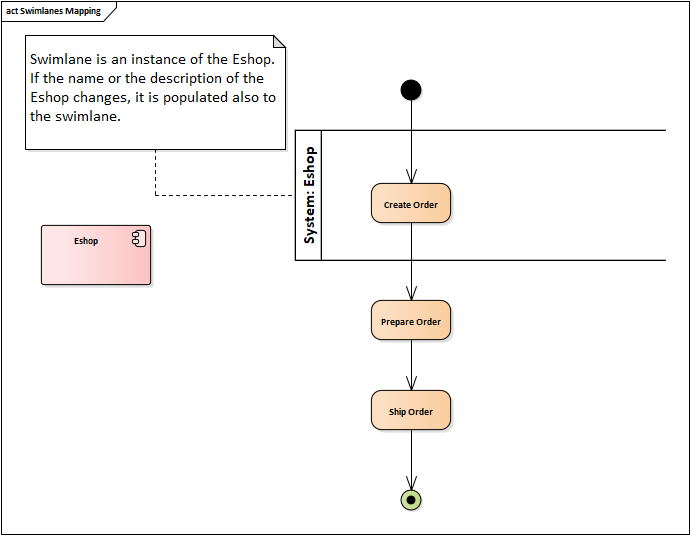
5. System or Role
Indicating which party (role) or what system performs a particular step is handled using swimlanes. Additionally, if the swimlane classifier points to a system in the repository, any changes to that system automatically propagate to the corresponding swimlane across all diagrams.
Note: In Part III we are going to provide more detailed information concerning the implementation of the practices mentioned above in a real CASE tool.