Process Model
A process is a set of activities that interact to achieve a result. A process model is a graphical representation of a particular process, showing the order of individual process steps along with an indication of who actually performs them.
In the context of analysis, process models represent:
- A business process describing how specific parts of the business work
- A process within a system showing how a particular part of the business process is realized in software
- A workflow specifying the flow of artifacts (tasks, documents, information) in the system from one person to another until a result is achieved
Usage
Processes are everywhere. Every organization is basically an organized system of processes and activities that are performed across organizational units, interact with one another, and transform inputs into outputs. Also, most information systems are built around processes and workflows, as the current trend is to design process-oriented systems that guide employees to perform their work in a specific order. With this approach, employees know exactly what the next step is, instead of having to figure out the best way to complete a task on their own.
Processes exist at all levels, from the business layer down to systems, making them an inevitable part of analytical work. Process analysis is performed to understand how a particular process works at the moment (as-is analysis), how it should work in the future (to-be analysis), or how processes will be impacted by an anticipated change (the delta between as-is and to-be).
If you do not know your processes, you cannot discover the impacts of changes.
High-level processes also represent an essential part of overviews. They can beautifully depict individual process steps together with information about who performs them, in which system, and what outputs each step produces.
Process Representation
The standard form of describing processes is a visual model. Rather than using free-form diagrams, analysts mostly rely on standardized notations, such as the UML Activity Diagram, BPMN (Business Process Model and Notation), or a Flowchart.
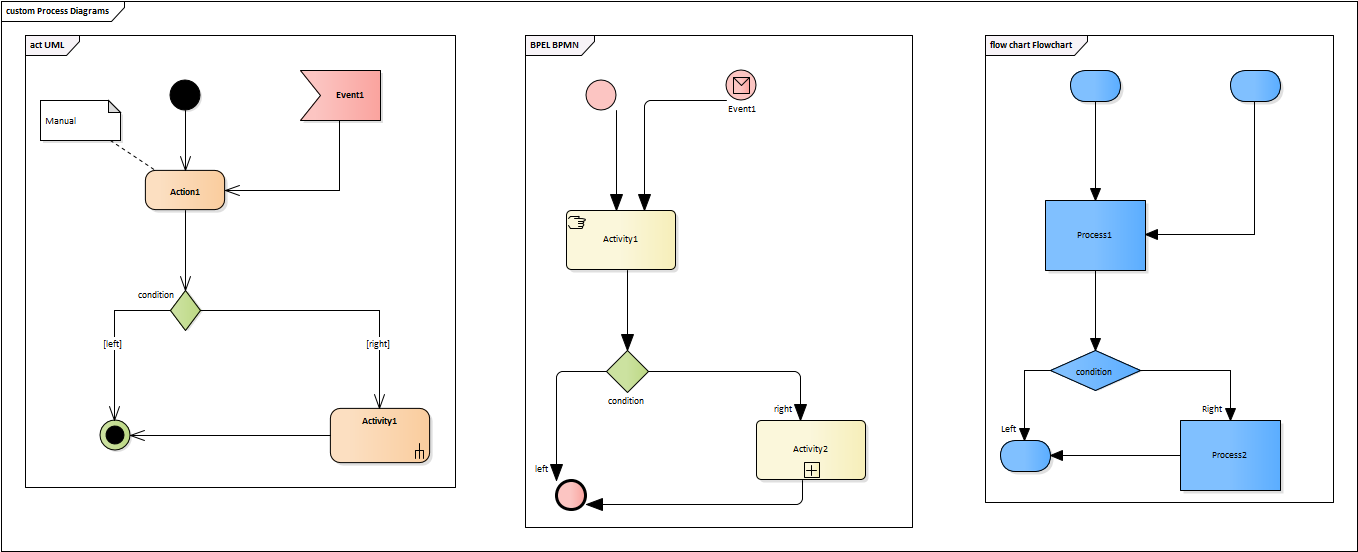
Which one should you use? Unfortunately, there is no single right answer. BPMN was designed specifically for modeling business processes, so it has the greatest expressive power in this area. However, its main advantage is also its biggest disadvantage. It is essentially a single-purpose notation, and to be so powerful, it must be complex, which makes its advanced features hard to read for business people. Unless you work in a dedicated team focusing exclusively on process modeling, the main disadvantages of BPMN will sooner or later become evident:
- Complex notation that very few people thoroughly understand
- It is very powerful, but its potential cannot be fully utilized because ordinary stakeholders cannot learn it quickly
- A single-purpose notation focused solely on business processes
- This is not a problem when the goal is to analyze only business processes. However, if the intention is to start with a business process and then elaborate deeper, potentially down to the systems level, BPMN will not be sufficient and will need to be combined with other techniques.
If any of the concerns above apply to your project, we recommend sticking with the UML Activity Diagram. It offers the same expressive power and can be used across all levels of abstraction.
Good Practices
Visual Style
Process models should follow standard diagram guidelines to ensure they are easy to understand and maintain.
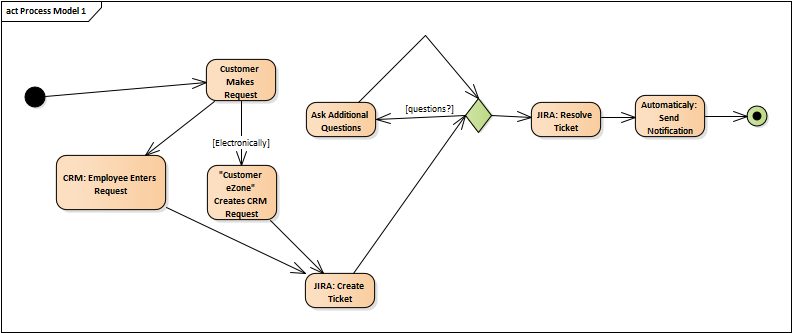
It is not that the diagram above is incomprehensible, but it could obviously be improved:
- Naming – Process steps should not include the names of actors or systems and should meet basic naming conventions: use the active voice, present tense, and start with a strong verb
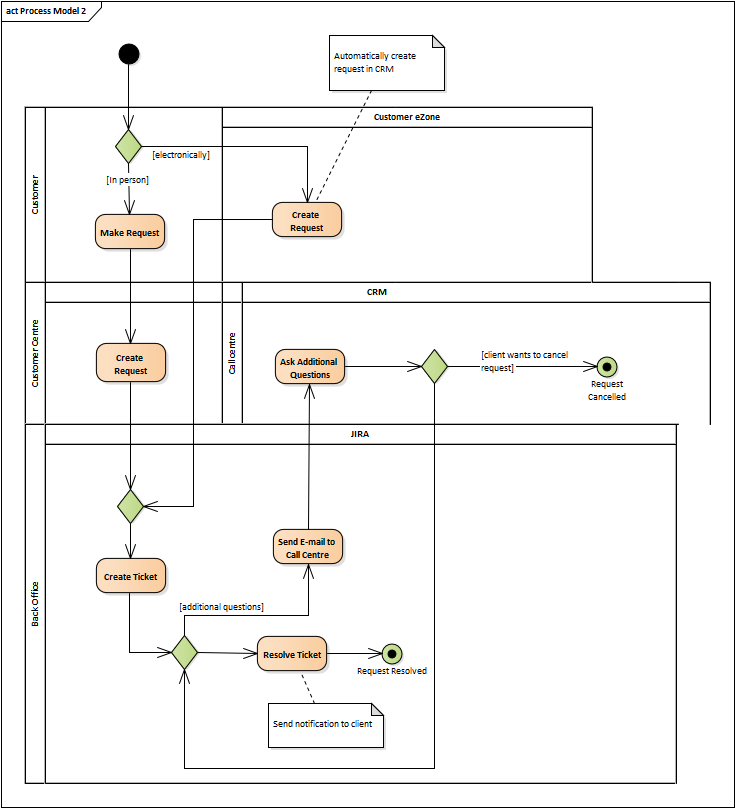
- Swimlanes – To indicate who performs a step and/or in which application the step is carried out, use swimlanes
- Layout – The diagram looks much neater if elements are aligned and spaced evenly. Elements should also be placed with respect to the process flow so that it can be read from left to right or from top to bottom
Consistent Granularity
Understanding a process usually requires modeling it at multiple levels of detail. The first step is describing a high-level L1 process, which shows the big picture. Once the basic flow is established, you can continue describing more detailed levels (L2, L3, etc.), where each level specifies a single step of the parent process. However, the analyst must ensure that the level of detail within each layer remains consistent.
Simple Diagrams
Process models, especially business process models, are the type of diagrams usually intended for discussion with business people. Most stakeholders can learn the basics of BPMN or UML Activity Diagrams very quickly, but we cannot expect them to master advanced features. For this reason, if the audience consists of business stakeholders, analysts should try to keep diagrams as simple as possible, applying only the basics of the selected notation.