
Documenting Requirements
The very first thing most people think of when it comes to requirements are textual statements such as "System shall do..." or "As a user I want..." stored in a spreadsheet table or in some issue tracking software. For this reason, a lot of people consider requirements something we write and which is then put into a textual document for review. This stereotype comes from the need to list requirements, prioritize them, and sort them. However, most requirements are better described using other methods than text, or even using a combination of several methods.
For example, on one of our last projects, not a single requirement was documented as a standalone textual statement. We were analyzing a workflow system for processing customer requests, and the whole application was described using a set of nested activity diagrams expressing the workflows. Of course, the individual activities were specified using text so that it was clear what the purpose of the step was, what data it should present, etc. But there was not a single "System shall..." or "As a user I want to..." statement because it was not needed for this particular case. The focus here was not on independent features, but rather on workflows and the behavior of each step, which would be hardly specified using text.
We will elaborate on this topic more in this chapter dedicated to use cases.
Another common antipattern is trying to specify all requirements in the same format. As was stated in previous chapters, there is not just one type of requirement, so naturally, they cannot all be documented the same way. The format must be tailored for each requirement individually, so all attempts to document requirements in a unified format will fail, no matter whether the prescribed format is textual or graphical.
Textual Requirements
One of the most common ways of specifying requirements is natural language. Putting down what the application is expected to do in a bullet list is quick and simple and does not require any specific skills. However, natural language has several drawbacks. First, it is ambiguous. An analyst must be very precise and choose words wisely to write a quality textual requirements specification that is clear and understood the same way by everybody. Next, it quickly becomes confused when complexity increases. And finally, it is very hard to review and maintain textual requirements, as each revision includes reading dozens of pages of text.
Despite the apparent disadvantages of textual requirements, it does not mean we should stop writing them completely. The textual form is a legitimate way of capturing requirements, and it might even be the best one in many cases. The textual form only becomes problematic when it is used inappropriately—when another form would be more effective or when the textual form is the only way requirements are specified on the project.
USE CASE
The most known representative of textual requirements techniques are use cases:
UC Calculate Total Price
- User selects two or more products and selects to calculate the total price
- System asks user to select a calculation algorithm
- Systems calculates the total price according to the selected algorithm
- System displays the calculated price
- System logs the calculation into a calculations history
Visual Requirements
Every requirement could be described in textual form. However, this would lead to having hundreds of textual statements that would be impossible to review and maintain. What is more, describing user interfaces, processes, or complex algorithms would be even hard to create. But even the visual form of requirements has its downsides, and it is not always the best choice. The following list summarizes the pros and cons of visual requirements:
- (+) Streamline analysis outputs, as capturing all requirements as text leads to jumbo specifications that are hard to read
- (+) Communicate requirements on a level that goes beyond what textual requirements can provide
- (+) Engage stakeholders' imagination, which helps them to review outputs and discover missing, extraneous, and inconsistent requirements
- (-) Take more time to create and maintain—use only when it is beneficial
- (-) Visualization itself is mostly not sufficient and must still be supplemented with textual descriptions—the visual form itself does not guarantee unambiguity
- (-) Visual elements must be inserted into requirements documents and need to be updated upon each change, which is complicated if it is not automated using tools
From the provided summary, it is obvious that visual requirements are not always the best choice and it should first be evaluated whether to visualize the requirement or not. An analyst must compare the advantages of visualization with the disadvantages, such as the increased time needed to create and maintain it.
Examples
Example 1: Create Customer Dialog
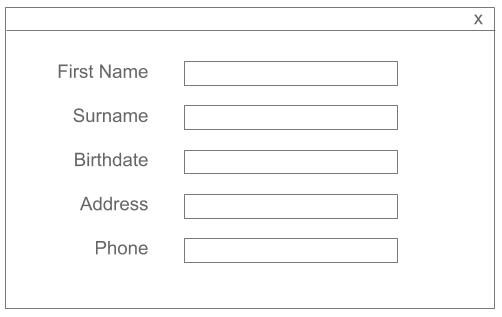
- First Name (1-40 characters, mandatory)
- Surname (1-40 characters, mandatory)
- Birthdate (US date format, mandatory)
- Address (1-200 characters, optional)
- Phone (US phone number format, optional)
Does visualization provide any additional value in this case? From the developer's point of view, the textual description of fields is sufficient. There is no complex logic that would justify additional effort, and in most cases, the screen will be tuned by a UX designer anyway. Thus, it is absolutely fine to provide just the textual definition, let developers create a prototype, and fine-tune it afterward. We will save valuable time for more important things.
Example 2: Request Workflow
The following specification describes a workflow that processes a customer request:
- Create Request
- Branch employee creates a new customer request
- If the selected request type is "Critical", it is automatically handed over to a manager (Investigate Critical Request). Otherwise, it goes to the investigator (Investigate Request)
- Investigate Request
- Investigator checks the request by following these steps in the wizard:
- Checklist
- If the investigation requires a statement from lawyers, the investigator hands it over to them (Assess Request). Otherwise, it goes to the reviewer (Peer Review).
- Investigate Critical Request
- Manager checks the request and directly either approves it or refuses it
- Assess Request (by the lawyer)
- Lawyer investigates the request and enters the result
- If the result is OK, then it is automatically handed over to the reviewer (Peer Review). Otherwise, the lawyer enters a reason for the negative statement and the request goes back to the investigator (Statement From Lawyers)
- Statement From Lawyers (when going back from Assess Request—by the lawyer)
- Display the negative statement from lawyers
- Close the request as "Refused"
- Peer Review
- Display all information provided by the investigator and lawyers
- If everything is ok, close the case as "Accepted"
- Otherwise, hand it over to the investigator
- Peer Review Result
- Display the issues found during the peer review
- Start a new investigation through Investigate Request/Investigate Critical Request
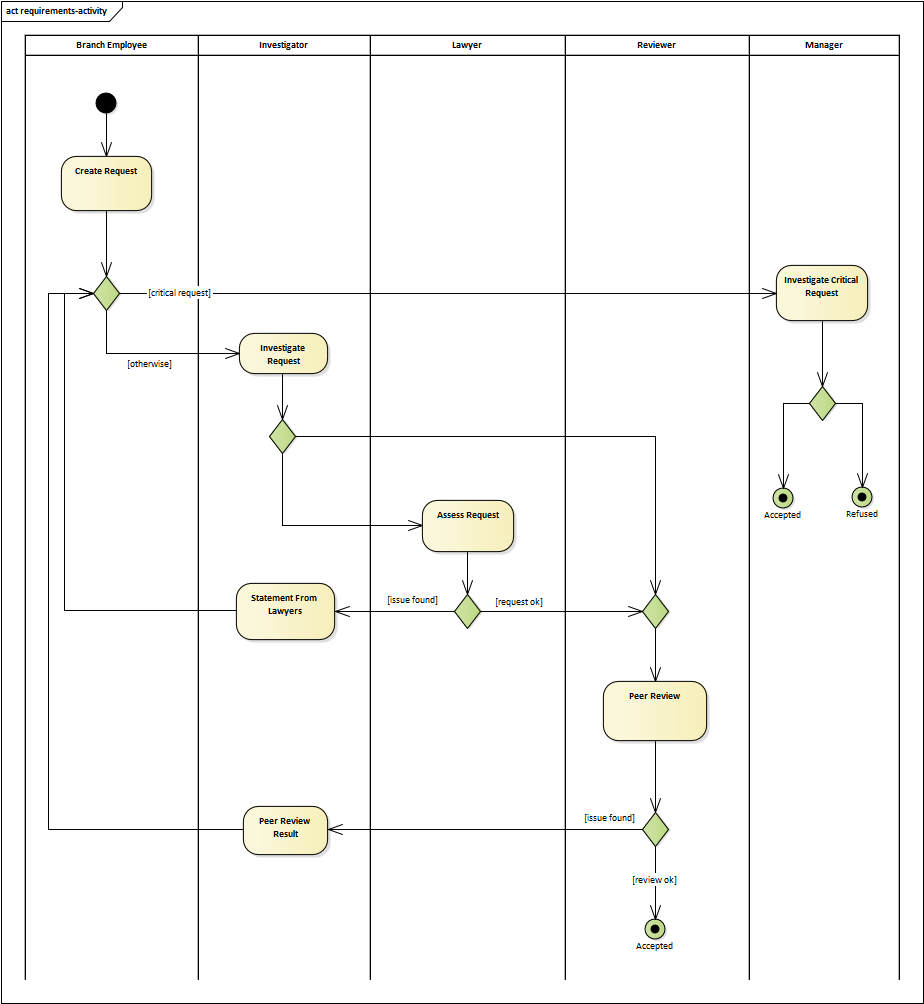
It is always so inconvenient to read a textual specification of a process or workflow. Not only does it take a lot of time to read and understand it, but it is also hard to spot mistakes and make changes to it. Processes and workflows should always be described using diagrams, which are easier to understand and maintain:
Requirements Visual Representations
In the previous section, we illustrated two possible approaches to documenting requirements visually—a user interface description and a workflow specification. Here, we are going to describe these approaches in more detail and add some more.
Diagrams
Diagrams present information using symbols, which makes them great for depicting complex logic that would be hard to capture with text. The visual elements that the diagram consists of could be standardized and form a so-called formal "notation". A notation is a set of symbols, where each symbol has a specific meaning. For example, the visualization of the process above is done using a standard UML activity diagram. There are various types of diagrams, and the most frequent are presented in this chapter.
Note: More information about diagrams could be found in this chapter.
User Interface
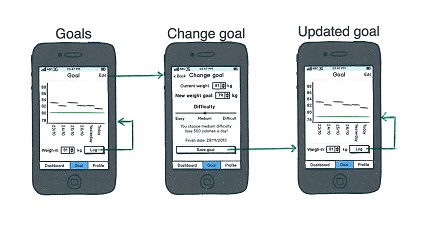
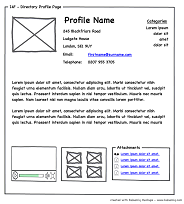
Visualizing user interfaces could be done on various levels, from very high-level hand-drawn sketches, screen flows, and interactive prototypes to pixel-perfect designs. If the aim is just to summarize the main elements of the screen so that the stakeholder could review the requirements, a wireframe is usually enough. Screen flows are best for illustrating possible navigation between individual screens without elaborating on the actual content of screens. The goal of prototypes is to validate requirements by letting the user actually use the product or its part, which is more fun than reading textual requirements.
Wireframe Example
Screen Flow Example
Trees
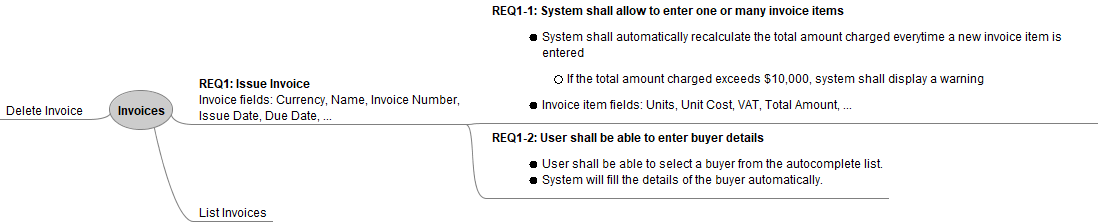
Trees are a great technique to visualize a structure. For example, application features are not a flat list. Features are broken down into functions, which might also be broken down into even more specific functions. The following tree is created using a mind map, which is very easy to create.
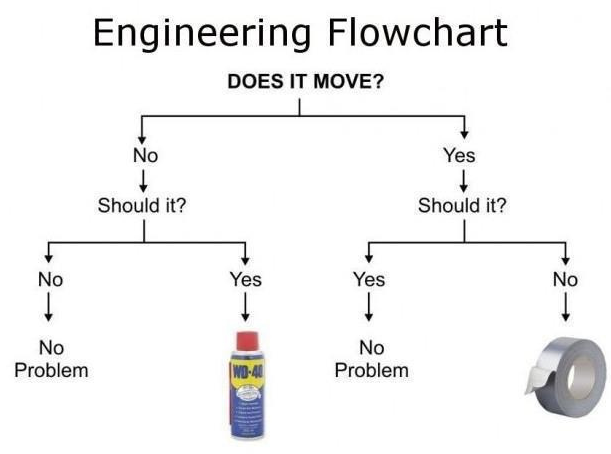
The ability of trees to depict structure is very often used for describing what action should be taken for given inputs. The technique is called decision trees, which are in fact flowcharts with only "if-then-else" statements:
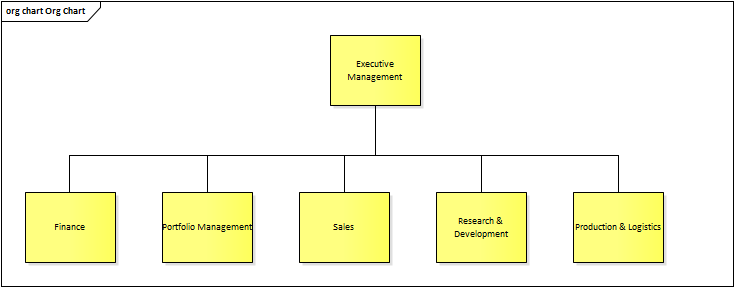
Another example of using trees is modeling organizational structures:
Tables
Tables are helpful when specifying a set of parameters for a system or a system element. The following example uses a table to define what data the system should accept when creating a new person:
| Attribute | Mandatory | Validation |
|---|---|---|
| Name | Yes | No |
| Address | Yes | No |
| Phone | Yes | US Phone format |
| Yes | Email format | |
| Employer | No | No |
| Salary | No | No |
Tables could also be used as an alternative to decision trees. They are typically used when the number of rules or inputs is too large for trees:
| Weight | Price |
|---|---|
| < 10 kg | $5 |
| >= 10 kg and <= 100 kg | $15 |
| > 100 kg | $35 |
Another usage of tables is capturing events that the system must respond to. This is typically used for embedded systems specifications where there is usually very little business logic, and core functions are defined by how the system responds to various events. The specification then has the form of an event-response table:
| Event | Response | State |
|---|---|---|
| Open Signal | Open Door | Opening |
| Close Signal | Close Door | Closing |
| Dog Recognized | Open Door | Opening |
| Open Door Timeout | Close Door | Closing |
| Finished Opening | - | Open |
| Finished Closing | - | Closed |
Combining Textual and Visual Requirements
Some requirements are better described with text, some with a diagram, and others are best communicated using a table or a tree. In practice, projects typically include requirements from multiple categories, so an analyst should always choose an appropriate mix of textual and visual requirements to ensure they are communicated in the most effective way.
Example: Create Loan Application
The bank introduced a new product and needs to enable its employees to create a loan application in the system. The basic idea of where and how the application will be initiated is described using a textual scenario. The textual form is fine here since it is a straightforward three-step scenario.
- Employee selects to create a loan application in the applications system (AppS)
- The application is started in AppS, but the employee is redirected to the LAppS application to finish it
- Employee creates the loan application through a series of steps in a wizard (in LAppS, see the diagram below for details)
- Employee is redirected back to AppS to finish the application and a standard application approval process is started
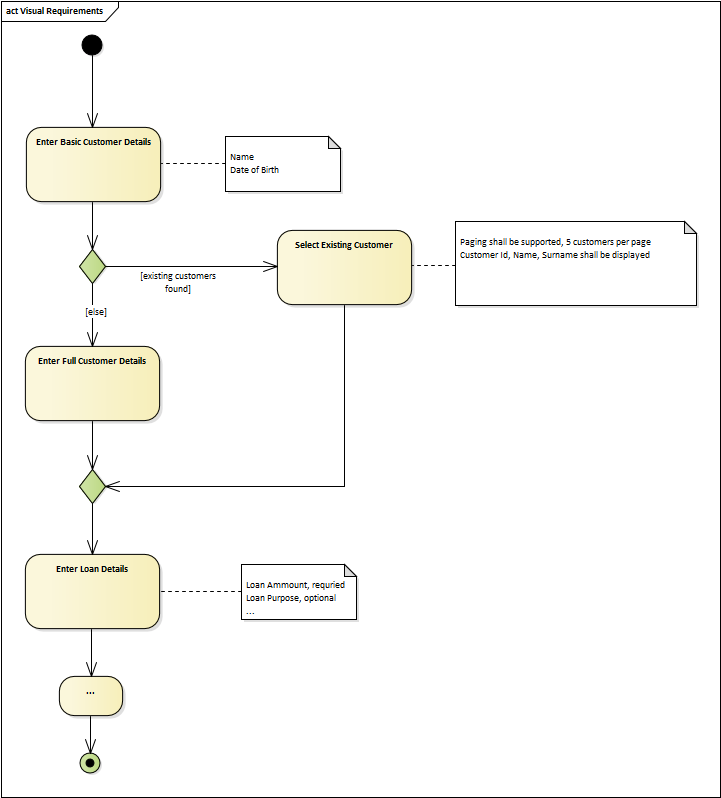
The main part specifying the actual creation of the application is more complex, so the analyst has selected to describe it using a diagram. It depicts the steps the employee needs to perform during the process, and each step is going to be represented by a separate screen within a wizard. Since the project will be implemented in an agile way, the analyst has not described all screens in detail upfront but has only outlined basic requirements, and the rest will be added ad hoc when it is needed. Until then, user interface descriptions are only textual.