Visualizing
Every aspect of business and IT architecture can be described purely in textual form. Business structures, processes, system integrations, or data structures can all be specified using either free or structured text. However, just because it is possible does not mean it is the best approach. Unfortunately, we see this pattern quite often: dozens of Word documents describing use cases, processes, and architecture, with each aspect spanning several pages. It is no wonder these projects fall behind schedule, as finding and reviewing information in such specifications is time-consuming and frustrating.
Although many types of information are better described using text (such as use case scenarios or definitions), certain details are much more efficiently communicated using visual elements. When it comes to visualization, the first thing that comes to mind for most analysts is diagrams. However, visualization goes beyond just diagrams.
1. Diagrams
Diagrams are excellent when the logic behind an aspect is complex (such as processes, workflows, or algorithms) or when the structure itself is key (such as a domain model or organizational chart). Despite the obvious benefits, many people still hesitate to use diagrams, arguing that stakeholders do not understand them and that there is no time to teach them the notation. While that may sometimes be true, it is the analyst’s responsibility to evaluate if and when an aspect should be expressed visually, depending on the target audience and the specific context. Nevertheless, stakeholders rarely refuse to discuss topics presented through diagrams. In fact, models usually become the primary medium of communication. Experience also shows that when analysts simplify diagram notations and stick to basic elements, stakeholders pick them up quickly. After a very brief introduction, they have no trouble reading them.
2. High-Level Pictures
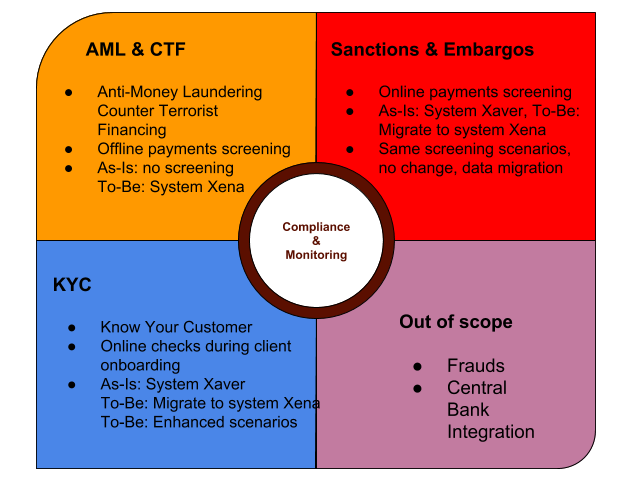
An essential part of an analyst's work is explaining concepts. Analysts repeatedly explain project scope, high-level system architecture, or business domain overviews to various parties. Even though a topic can be introduced in a paragraph or two, having a high-level introductory schema is incredibly useful. A diagram that is easy to understand can be used anytime you need to quickly explain a subject to someone.
The following schema represents a quick overview of a project scope, showing the affected areas of Compliance and Monitoring in a bank, including the impacted systems.
3. Demonstrations
The idea behind demonstrations is to show stakeholders something concrete as soon as possible to help them visualize the solution. The goal is to encourage stakeholders to think about the problem differently and uncover issues that would otherwise remain hidden. The specific demonstration technique depends on the subject. It could involve simple UI sketches and prototypes, or live process walk-throughs. In any case, once stakeholders see something real—even if it is hand-drawn on a napkin—they will immediately start adding new details, which is exactly what analysts need!